Data I/O Cheat Sheet for Dynamics 365 F/SCM

There are many ways how to access, import and export data in Dynamics 365 Finance & Supply Chain Management. Find here a one page PDF summary of 12 common ways. Every solution has it pros and cons.

Find broken reference in Excel

I recently had to find a broken reference in an Excel file, where data was copied from one version of the file to another. In the original version there was a data validation rule with a dropdown to a list of allowed base data from another excel sheet.

Drop down to choose from list of value

In a next step the original file was copied and modified to fit new requirements. Meanwhile the original file was used and data was collected in the old file.

After the new file version was approved, the data from the old version was copied (CTRL+C , CTRL+V) to the new file and the old file was removed. However, when opening the new file excel reported a broken link to the old file.

Broken reference after copying data

While this problem can easily be identified in a small excel, this can be a challenge in a huge file with lot of sheets. One way to identify the problem is to unzip the excel file (e.g. using winrar, 7zip, etc). A excel file contains many XML and other files. The worksheets for examle can be found in the xl/worksheets folder

Excel file opend in Winrar

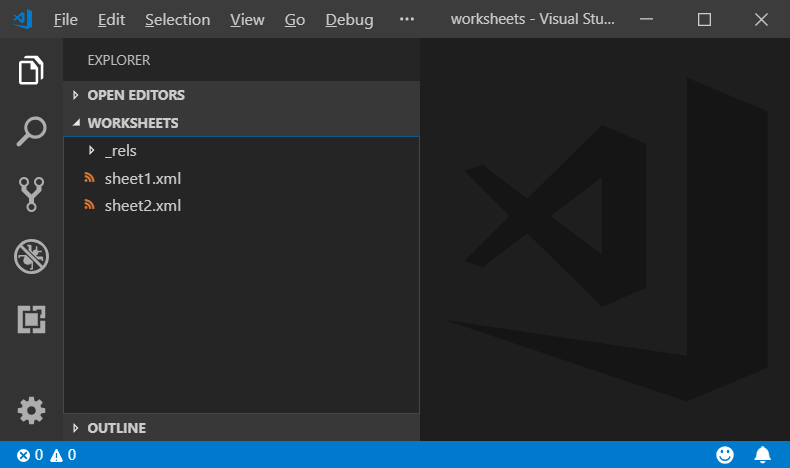
After extracting the worksheet folder to the file system, you may use a tool like Visual Studio Code and open the folder.

Open extracted excel folder in VS Code

Simple by searching for the name of the broken reference you will find the place where to fix the problem

Broken reference in excel

Using Bing Maps app in Excel to visualize inventory on hand data

This video shows how to use Bing Maps app in Excel to visualize on-hand data

Use Aggregation Function in Document Data Source

Dynamics AX 2012 supports to publish a query as document data source e.g. to load data in excel. However, document data sources are very limited. For example aggregation like sum() is not supported. Here is an example

  • Create a new query and use the CustInvoiceJour as datasource.
  • Set the Dynamic Fields property to No, but add a SUM field for the InvoiceAmoutMST
  • Append the LogisticsPostalAddress as datasource to the CustInvoiveJour
  • Add a relation and use the predefined InvoicePostalAddress_FK relation
  • Set the Dynamic Fields property to No, but add the CoutryRegionId and City
  • In the query add CountryRegionId and City as Group By Fields

Dynamics AX Query with SUM aggregation


Go to System Administration > Setup > Document Management > Document data sources > Add a query reference for the newly create query.

Publish Query with aggregation function as document data source

When you try to load data from this query using Excel Addins, you will face an error message.

Query with aggregation functions fails in Dynamics AX Excel Addin

When you open the document data source in a browser, your will see that there are no useful entries in the data feed. By default the URL is http://localhost:8101/DynamicsAx/Services/ODataQueryService

Dynamics AX OData XML feed has no data

However, one simple workaround is to create a view based on the query.

  • Create a new view
  • Add the previous create query as data source
  • Add the SUM field, CountryRegionId and City to the view fields

Create a view for the query

Open the view. The result should look like this

Dynamics AX view displays query data

Finally, create a second view and use the view as data source. Add a query reference to the second query at the document data sources. The data feed now contains valid data.

Dynamics AX OData XML feed with aggregated data

Now you can load your data using Excel Addins.

Dynamics AX Excel Addin with aggregated SUM data

View Sales Data on Map in Excel 2013

Excel provides great BI features for end users and professionals. Loading, transforming and presenting data can easily be done with PowerView and PowerMap. This is an example to visualize Dynamics AX sales data.

Dynamics AX sales data in PowerMap

Prerequisites

Provide Data via ODataFeed

  1. Open Dynamics AX 2012 R2 development workspace
  2. Create a new Query called ERPCustInvoiceJour
  3. Add the CustInvoiceJour as datasource, set the Fields Dynamic property to false
  4. Add InvoiceAmount, InvoiceDate and CustGroup to the field list
  5. Add the LogisticsPostalAddress
  6. Add the CountryRegionId and City to the field list
  7. Set the Relations property to No
  8. Add a new relation manually, clear the Field and Related Field property but select InvoicePostalAddress_FK

image

In Dynamics AX Application workspace go to Organisation Administration > Setup > Document Management > Document Data Sources. Create a new record for module “Sales and Marketing”, type Query Reference for ERPCustInvoiceJour query. Enable the data source.

image

Open the ODataFeed in a browser, depending on the server name and AOS Port it should look like this http://localhost:8101/DynamicsAx/Services/ODataQueryService/ERPCustInvoiceJour

image

Enable PlugIns

  1. Open Excel and go to File > Options > Add Ins > COM Add-ins > Go…
  2. Enable PowerPivot, PowerView and PowerMap

image

          Create Map

        In Excel go to DATA > From other sources > Data Feed > provide the URL from Dynamics AX data feed. Load the data in Excel. go to INSERT > Map. Set the LogisticsPostalAddress_City as Geography field and click next.

      image

      Leave the Type as Column. Set the CustInvoiceJour_InvoiceAmount as Height for the Column. Set the CustInvoiceJour_CustGroup as Category and CustInvoiceJour_InvoiceDate as Time.

      image

      Run the map time line and watch where and when sales takes place. Watch the implementation in this short video

      Create a PowerPivot BI Application for AX Project Postings

      PowerPivot is a great extension for Excel to realize BI applications in very short. For Excel 2010 download and install the free PowerPivot extension. PowerPivot ist built in with Excel 2013. To activate PowerPivot go to File > Options > Addins > Choose COM Addins > activate PowerPivot.

      PowerPivot Tab in Excel 2010

      Load Data

      Open PowerPivot Window > External Data > SQL Server. Provide Credentials to access Dynamics AX database. Select PROJTABLE, PROJJOURNALTRANS, HCMWORKER and DIRPARTYTABLE. For each table open the preview and select the following fields.

      ProjTable ProjId Name DataAreaId        
      ProjJournalTrans ProjId CategoryId Txt Qty Transdate Worker DataAreaId
      HcmWorker Person RecId          
      DirPartytable Name RecId          

      In the import wizard set a filter on the DataAreaId for PROJTABLE and PROJJOURNALTRANS on CEU

      PowerPivot Data Import

      After the tables have been imported, create relations between these tables. Back in the PowerPivot window > Relations > Manage Relations create these relations.

      • ProjJournalTrans[PROJID] to ProjTable[PROJID]
      • ProjJournaltrans[WORKER] to HcmWorker[RECID]
      • HcmWorker[PERSON] to DirPartytable[RECID]
        Data Model in PowerPivot
        In the PowerPivot window select PROJJOURNALTRANS table and on the right side after the last column select the new empty column. Write =YEAR(‘PROJJOURNALTRANS’[TRANSDATE]) in the formula text field. Rename the new calculated field to YEAR. Add a second calculated column =MONTH(‘PROJJOURNALTRANS’[TRANSDATE]) and rename to MONTH

      Calculated Field in PowerPivot

      Create the first pivot table

      Close the PowerPivot windows and return to Excel. From the PowerPivot tab create new pivot table. Place the PROJJOURNALTRANS[QTY] field in the right lower Values box. Place PROJTABLE[NAME] and PROJJOURNALTRANS[CATEGORYID] in the rows box. Place PROJTABLE[NAME] and PROJJOURNALTRANS[CATEGORYID] in the vertical slicer box. Place PROJJOURNALTRANS[YEAR] and PROJJOURNALTRANS[MONTH] in the columns box and horizontal slicer.

      Pivot Table based on Dynamics AX Data

      Create charts

      From the PowerPivot tab open the PowerPivot table dropdown, select 2 charts vertical and place them in a new sheet. For both charts place the PROJJOURNALTRANS[QTY] in the lower right values box. For the first diagram place the PROJTABLE[NAME] field in the columns box. In the second diagram place the DIRPARTYTABLE[NAME] in the rows box. Now there are two diagrams, postings per employee and postings per project. Place PROJTABLE[NAME], PROJJOURNALTRANS[CATEGORYID] and DIRPARTYTABLE[NAME] in the vertical slicer. Place PROJJOURNALTRANS[YEAR] and PROJJOURNALTRANS[MONTH] in the horizontal slicer.

      Dynamics AX Project Postings per Project and per Employee

      Connect Slicer to other sheets

      Select the YEAR slicer, from the context menu open the pivot table connections. Connect the slicer to the other pivot table created earlier. By connecting the slicer a selection made on one sheet also effects the other sheet.

      PowerPivot Slicer

      Create Measures and define a KPI

      From the PowerPivot tab, PowerPivot table dropdown create a new simple pivot table on a new sheet. Place the DIRPARTYTABLE[NAME] field in the rows box. Place the PROJJOURNALTRANS[YEAR] in the horizontal slicer On the fieldlist select the PROJJOURNALTRANS table and create a new measure from the PowerPivot tab. Call the measure M_TOTAL and use the formula  =sum(PROJJOURNALTRANS[QTY])

      PowerPivot Measure posted Qty

      Create a second measure on the PROJJOURNALTRANS table called M_ABSENCE. This will be the sum of all postings made on project HOLIDAY (PROJID 50002) and ILLNESS (PROJID 50003). Use the formula
      =CALCULATE(sum([QTY]);PROJJOURNALTRANS[PROJID] = "50002" || PROJJOURNALTRANS[PROJID] = "50003") .

      PowerPivot Measure posted Qty on Holiday or Illness

      On the fieldlist, select the measure M_ABSENCE in the PROJJOURNALTRANS table. From the PowerPivot tab, create a new Key Performance Indicator (KPI) based on the M_ABSENCE Measure. Select the M_TOTAL as target. Choose green > yellow > red color schema. Define green to be from 0 – 5 percent, yellow from 5 to 10 percent and red to all above.

      PowerPivot KPI

      The pivot table with KPI should look like this

      PowerPivot table with KPI