Here is my second video on Unified Price Management explaining how to Best-Price discounts work and how to configure concurrent Back-to-School and Black-Friday discounts.
Since Tier1 Cloud Hosted Environments (CHE) will be deprecated, there are still good reasons (💰) to use them anyway instead of UDEs. Tier1 CHE from withing Lifecycle Services can be paired with Power Platform environment including Dual Write Configuration with Dynamics 365 Sales. In the Tier1 configuration I’ve encountered an authentication error at creating new records in FO.
History and symptoms 🤒
I’ve deployed a new Tier1 Dev/Test Environment 10.0.43 to the linked Azure Subscriptions. At the configuration dialog in LCS I’ve enabled Power Platform integration based on Dynamics 365 Sandbox. Deployment took a while but succeeded. 👍
After the deployment I’ve restored a AxDB database with some basic configurations and performed a full database synchronization in Visual Studio. 👍
Next I’ve linked the D365 Finance and Supply Chain machine with the deployed D365 Sales Sandbox environment from the LCS environment details page. Finally I’ve enabled the Dual Write Configuration also from the LCS environment details page. 👍
In Power Platform Admin Center, Environment, Dynamics 365 Apps two solutions were already deployed. Dynamics 365 Dual Write Core and Dynamics 365 Dual Write Application Core. Because the environment was a sales prototype I’ve added the Dynamics 365 Dual Write Human Resource, Dynamics 365 Dual Write Finance, Dynamics 365 HR Common Tables (!), Dynamics 365 Dual Write Global Address Book and Dynamics 365 Dual Write Supply Chain Solution from the App Source. 👍
In Dynamics 365 Finance & Supply Chain at the Data Management Workspace I’ve imported the Core Solution and Supply Chain Solution. The table mappings have been populated successfully and I’ve choosen to synchronize only one legal entity (company) with Sales. 👍
The basic table mappings (e.g. Legal Entities, Customer Groups, Currencies, Units, Size, Colors, etc.) including initial synchronization from FO to Sales were successful. I’ve also enabled synchronization between CustomersV3 and Accounts👍
In Dynamics 365 Sales it was possible to create a new account from type customer, link it to the corresponding legal entity and assign a customer group. The customer account from Dynamics 365 Sales was successfully synchronized into FO within seconds and became a customer. 👍
Vice versa, from Dynamics 365 Finance Supply Chain to Dynamics 365 Sales did not work. As soon as a new records in a synchronized table was create a Dual Write error message came up. No matter if it was a customer, product, etc. 🤬
Unable to write data to entity accounts
Authentication failed with error
Failed to authenticate for https://__crm4.dynamics.com/api/data/v9.0/accounts
For information on troubleshooting see
https://go.microsoft.com/fwlink/?linkid=2244045
Unable to get access token
Solution Step-by-Step
Microsoft has cut off CHE connections from accessing tenant information. I found some blog posts from other folks dealing with Business Events and a Microsoft documentation to setup Onebox environments. Following the instructions I’ve done the following:
App Registration
I’ve created an App Registration in EntraID. I’ve added the URL of the D365 FO Environment as response URL from type Web as well as the URL including /oauth
I gave API permissions to User.Read, User.Read.All, Dynamics ERP AX.FullAccess and LCS user_impersonation.
Self-Signed Certificate via PowerShell
Following the documentation I’ve create a simple self-signed certification via PowerShell on the Tier1 VM.
The export generates a .cer file. By double clicking the file you can install the file on the computer. I’ve done this twice. As local machine and choosen the place to be the root certificate authorities. The same with installation as user and also selected the installation to be placed in the root certificate authorities.
web.config and wif.config
The web.config file can be found at K:\AosService\WebRoot directory. I’ve made a copy before editing and changed the following lines. The spn: is the application ID from the app registration. The thumbprint can be found in the .cer file on the Details tab.
In the wif.config I’ve also added the application ID
<?xml version="1.0"?>
<system.identityModel>
  <identityConfiguration>
    <securityTokenHandlers>
      <securityTokenHandlerConfiguration>
        <audienceUris>
       <!-- WARNING: MUST be first element; updated at web role instance startup -->
          <add value="spn:00000015-0000-0000-c000-000000000000" />
          <add value="spn:MY_APP_ID_HERE" />
Application User in Dynamics 365 Power Platform
In the Power Platform Admin Center, on the environment page, under settings in groups users I’ve added an application user. I’ve assigned System Administrator Role like the already existing Finance and Operations Service account.
EntraID Application in FO
Finally to avoid any additional problems I’ve also create a new record in Dynamics 365 Finance Supply Chain at the EntraID Applications page.
Finally the synchronization from Dynamics 365 Finance Supply Chain to Dynamics 365 Sales was working. Customers, Products, Sales Orders, Invoices etc. can be created in FO and be found Sales. 💚
Since the original Dual Write Orchestration packages has been replaced by a pack of smaller packages, its needed to setup the packages in the correct order. You can deploy a Power Platform environment using the Dynamics 365 template from within LCS.
Also from the Environment Full Details page, you can trigger the installation of Dual Write solution and initial configure the Dual Write solution. You will end up with Dual Write Core and Dual Write Application Core Solutions installed. To have the full Dual Write Experience you have to install the other Packages as well.
You might run into an installation error when deploying Dual-Write packages from App Source.
Error details
How to troubleshoot
To fix this problem retry installation. For directions on how to do this see here.

msdyn_Dynamics365SupplyChainExtendedAnchor
NotProvided
Solution manifest import: FAILURE: The following solution cannot be imported: Dynamics365SupplyChainExtended. Some dependencies are missing. The missing dependencies are : <MissingDependencies><MissingDependency canResolveMissingDependency="True"><Required type="1" schemaName="cdm_worker" displayName="Worker" solution="HCMCommon (2.2.0.3)" /><Dependent type="10" schemaName="msdyn_transferorder_receivingcontactpersonnel" displayName="msdyn_transferorder_receivingcontactpersonnel" parentSchemaName="cdm_worker" parentDisplayName="Worker" /></MissingDependency></MissingDependencies> , ProductUpdatesOnly : False
There is also an additional required package that is not labeled “Dual Write” but required, the Dynamics 365 HR Common Tables package:
Here is an order of installation that worked for me (Apr. 2025)
The combination of Dynamics 365 Finance and Supply Chain Management Cloud ERP and Microsoft Flow helps to automate many tasks. For example, you can easily notify a customer about changes regarding the confirmed shipping date.
Concept
Configure a Blob Storage Endpoint for Business Events
Create a Change Based alert for ShippingDateConfirmed
Add a flow that triggers on new events
Read Email from sales order and notify customer
Configure a Business Event Endpoint
Business events in Dynamics 365 FSCM can be used to notify external systems. It supports different endpoint types like Azure Event Hub, HTTPS web hook and Blob Storage Account. I personally prefer to use a storage account because it’s a very cheap and easy to use, understand and support cloud infrastructure.
In Entra ID admin Portal (Azure Active Directory) create a new app registration. Note the client ID and create a new secret. Note the application secret as well.
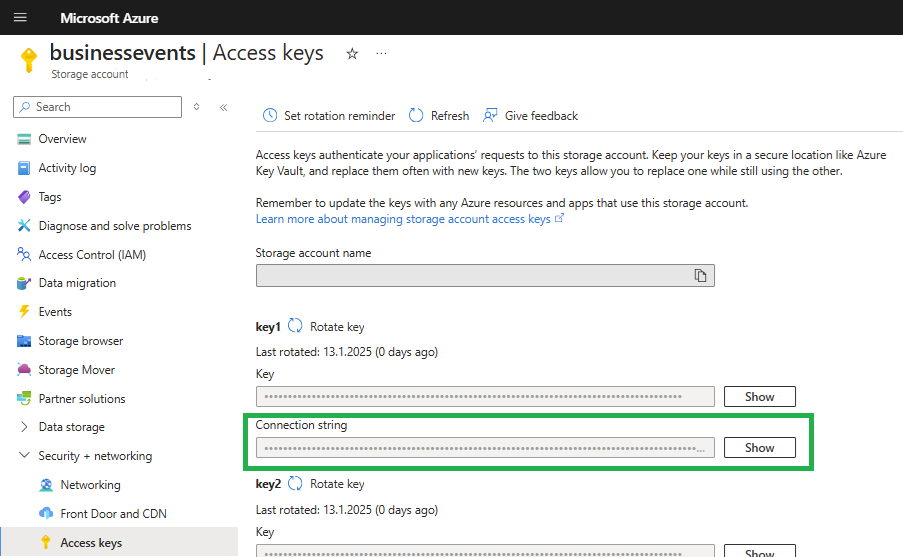
In order to use a Blob Container for Business Events you need some resources. First, of course a storage account with a public endpoint. Copy the Storage Account Connection String. On the menu on the left side select Storage browser. Navigate to the Blob Storage and create a new container.
Next, create a key vault to store the connection string. When creating the key vault make sure to use Vault Access Policies. At the key vault create a new secret and place the connection string there.
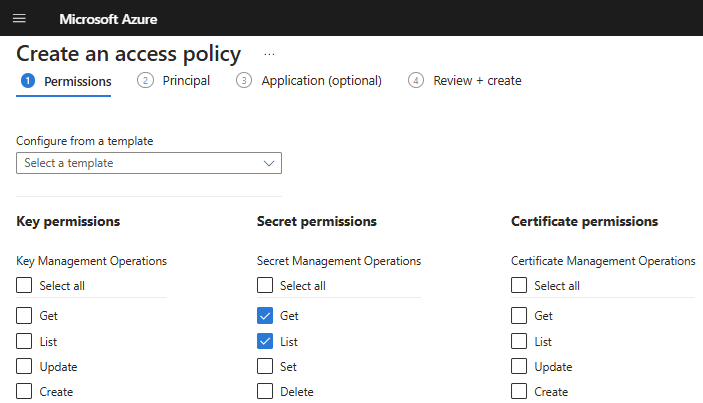
In the Key Vault switch to Access Policies and create a new one. Assign the registered app the rights to list and get secrets.
In Dynamics 365 Finance and Supply Chain Management open the Business Event Catalog (System Administration > Setup > Business Events). Switch to the Enpoint tab and create a new Blob Endpoint. In the dialog provide
the name of the secret that holds the connection string
Switch to the Business Event Catalog and filter the Business Event ID entries containing the term “Alert”. Make sure you select the BusinessEventsAlertEvent and click on Activate. In the dialog select the legal entity and the recently created blob endpoint.
Test Business Event Endpoint configuration for Alerts
Make sure you have a batch job handling change based alerts in Dynamics 365 Finance and Supply Chain. If you don’t have such a batch job, create on from System Administration > Periodic Tasks > Alerts > Change Based Alerts. Change the recurrence to no end date and provide a time interval e.g 10 minutes.
In Dynamics 365 FSCM go to an existing sales order or create one. In the top menu switch to Options and select Create custom alert.
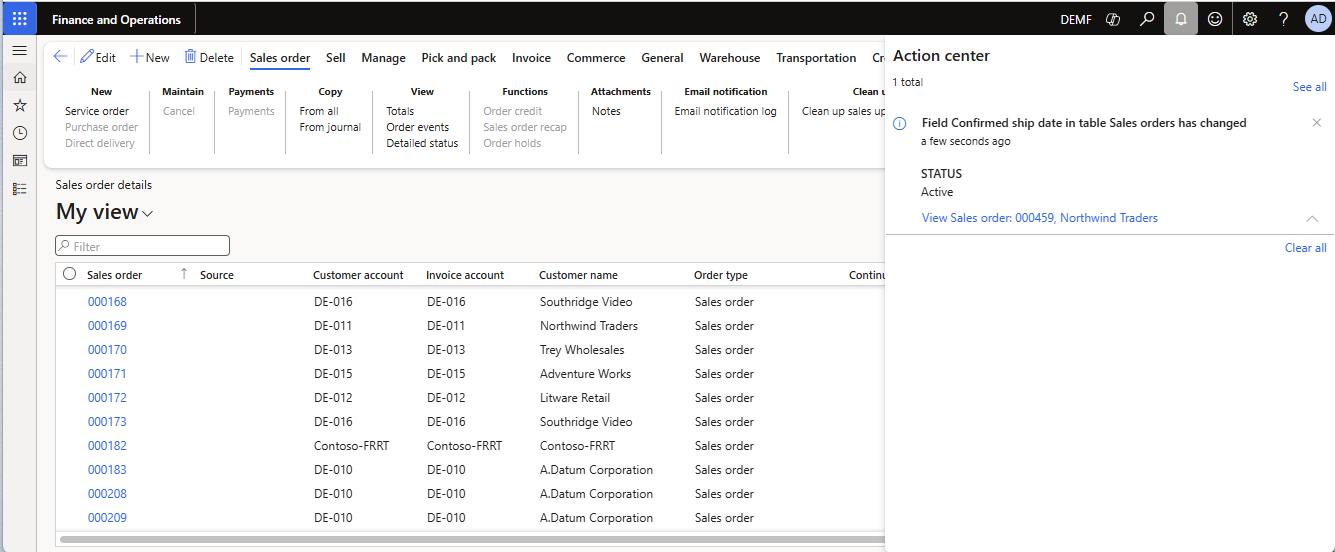
In the alert dialog choose the Confirmed Ship Date from the field drop down. This will change the alert trigger to Has Changed. Make sure to activate the Send Externally Option as well. Save the alert rule.
Change the confirmed ship date in the sales order. Depending on the time interval for change based alerts batch job you will get notified that the value has been changed.
Switch to the Azure Portal and go to your storage account. From the Storage Browser, select the Blob Storage and the container you created for the business events. There you should see at least one entry named as GUID.
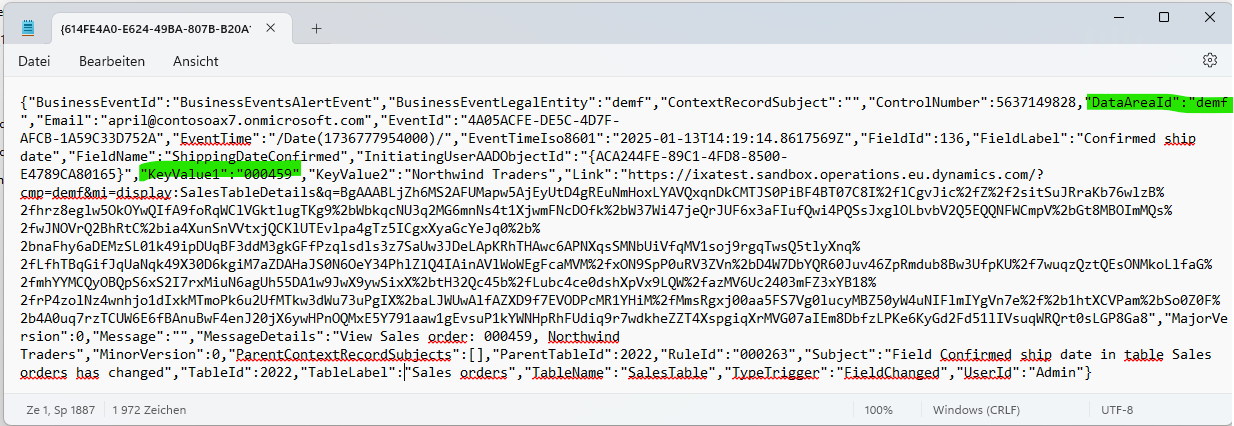
Download and open the file in a text editor. I should contain the JSON for the business event. You will find the Sales Order Number in KeyValue1 and the legal entity in the DataAreaId property. You can use this values to lookup the sales order in D365.
Create a flow to notify the customer
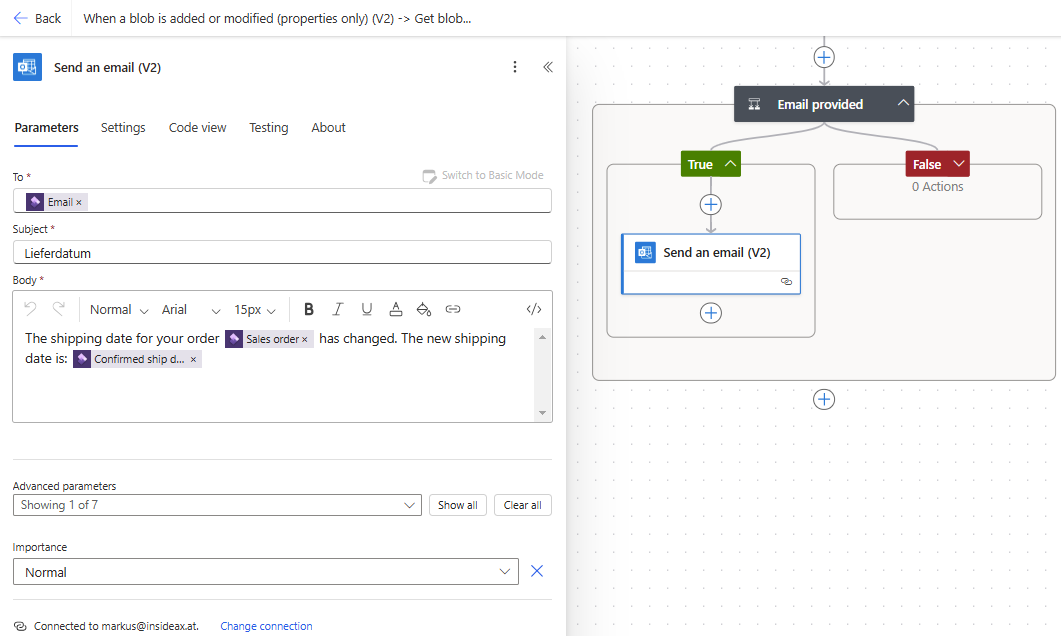
Go to Power Automate and create a new flow that triggers when a blob entry is created or modified. Check if the event was a shipping data change and send an email to the customer. The flow may look like this.
The first action Get Blob Content is used to download the event file itself. The next action will parse the event JSON string. Since the blob file has no file extension, it is necessary to provide the content as string() to the Parser. The schema can be generated by example. E.g. copy the JSON string from the test file and flow will generate the schema.
Because the blob storage account may be used by different business events in the future it is advised to add a condition to check if the alert is triggered by the shipping date.
Next use the DataAreaId and KeyFieldValue1 to lookup the Sales Order in Dynamics 365 FSCM by combining both values seperated with a comma e.g. demf,001234
Add a second condition to check if there is an Email address provided in the sales header. If so use the Send Email action to notify the customer. If required you may work on the FALSE condition and lookup the customer instead to find an email address.
Combining views and wildcard selects on customized tables in Synapse may cause unforeseen problems. For example, I’ve created a view that combines all fields one table with additional fields from a joined table.
SELECT table1.*, table2.field1, table2.field2, table3.field3
from
table1 left outer join table2 on
table1.id = table2.id and table1.dataareaid = table2.dataareaid
In Synapse Workspace I’ve added a SQL Database called “Dynamics” and create the view. PowerBI Users would use the views from the Dynamics database instead of loading and joining raw tables by themselves.
A customization was made on table1. An additional field was added. The new field was synced to Synapse. Querying table1 in Synapse returned all its fields. Executing the SQL query on which the view is based als returned all the fields from table1 and the joined table2. However, the view itself in the Dynamics database in Synapse did not show the new field in the returned column headers.
The Lake Database in Synapse returned correct dataset but the view used its original field definition. So the data was shifted 1 field to the right and all values after the customized field were in the wrong column. For example, the value 1 from the new field was returned in the column Partition. The value 2024 from the Partition was returned as Field1. The value from Field1 was returned in Field2.
A quick and simple fix is to rerun the ALTER VIEW statement with the original code.
If you have the need to insert data into Dynamics 365 Finance and Supply Chain Management via Excel but don’t want to use the Addin you can do this task manually via VBA Code. Here is an example how to create a new customer via CustomerV3 OData entity.
App Registration
You have to register a new application in Entra ID. Allow API access to Dynamics 365 FSCM Entities. Create an application secret and note the value somewhere. Next you have to register the App ID (Client ID) in Dynamics 365 FSCM in the Entra ID Application form.
Authentication
OData in Dynamics 365 FSCM uses OAuth for authentication. You have to request an access token first and use it later for the communication with D365. In Excel create a VBA function that request an access token based on the Application Registration.
Function CreateAccessToken() As String
  Dim tenantId As String
  Dim clientId As String
  Dim secret As String
  Dim scope As String

'PROVIDE YOUR DATA HERE
  tenantId = ""
  clientId = ""
  secret = ""
  scope = "https://YOUR_D365FO_URL_dynamics.com/.default"

  Set objHTTP = CreateObject("MSXML2.ServerXMLHTTP")

  strURL = "https://login.microsoft.com/" & tenantId & "/oauth2/v2.0/token"
  strData = "tenant_id=" & tenantId & "&client_id=" & clientId & "&client_secret=" & secret & "&grant_type=client_credentials&scope=" & scope & ""

  objHTTP.Open "POST", strURL, False
  objHTTP.send (strData)
  strResponse = objHTTP.responseText
  Set objHTTP = Nothing

  Dim posAccessToken As Integer
  posAccessToken = InStr(1, strResponse, "access_token", vbTextCompare)
  posAccessToken = posAccessToken + 14

  Dim token As String
  token = Right(strResponse, Len(strResponse) - posAccessToken)
  token = Left(token, Len(token) - 2)

  CreateAccessToken = token
End Function
Data Entry Form
Create a form in Excel to provide the required data. In my example there is no AccountNum because it is generated in Dynamics 365 FSCM from a Number Sequence. Add a button and link it to a VBA Macro.
Call the CustomerV3 Entity from VBA
To create a new customer create an HTTP POST request to the CustomerV3 OData Entity. Provide the required fields as JSON String. Here is an example:
Sub CreateCustomerV3()

  Dim url As String
  Dim http As Object
  Dim data As String
  Dim response As String

  Dim token As String
  token = CreateAccessToken

  url = "https://YOUR_D365FO_ENV.dynamics.com/data/CustomersV3"

  Set http = CreateObject("MSXML2.ServerXMLHTTP.6.0")

  Dim name As String
  Dim cur As String
  Dim grp As String
  Dim cmp As String

  name = Cells(3, 3).Value
  cur = Cells(4, 3).Value
  grp = Cells(5, 3).Value
  cmp = Cells(6, 3).Value

  data = "{""OrganizationName"" : "" " & name & " "",""SalesCurrencyCode"": """ & cur & """,""CustomerGroupId"": """ & grp & """,""dataAreaId"" : """ & cmp & """}"

  http.Open "POST", url, False
  http.setRequestHeader "Authorization", "Bearer " & token
  http.setRequestHeader "Content-Type", "application/json"
  http.send data

  response = http.responseText

  'Only for debugging
  Cells(10, 5).Value = response
End Sub
To query D365 Finance and Supply Chain Management OData entities from external sources you can use simple HTTP GET Requests. Here is an example for Excel and VBA code.
App Registration in Microsoft Entra ID
In Entra ID (Azure Active Directory) create a new app registration.
Provide a meaningful name for your registration
Select only accounts in the organization
Leave the Redirect URL blank
Create a new secret. Make sure to copy the secret value because it will not be shown again.
Give the API Permissions for Application Connector.FullAccess and Delegated Odata.FullAccess
Configure D365 F/SCM Entra ID Application
In Dynamics 365 Finance and Supply Chain Management navigate to System Administration > Setup > Entra ID Application. Create a new record using the Client ID from the app registration, a meaningful name and associate a user account in D365.
Request a Bearer Token
To request a bearer token we have to call login.microsoft.com with the Tenant ID and v2.0 version: https://login.microsoft.com/TENANT_GUID_HERE/oauth2/v2.0/token . The tenant ID is a GUID that can be found in Entra ID Portal. You have to provide additional data in the request:
tenant_id: Again the GUID of your Azure Active Directory
client_id: App registration client ID
client_secret: App registration secret value
grant_type: “client_credentials” (hardcoded string value for this type of request)
scope: your Dynamics 365 FSCM URL followed by /.default
I recommend to try this in Postman before coding in Excel VBA because it’s easier to debug and test.
Here is the Excel VBA code to call an HTTP POST request and send the data to get a token. Fill in your values for tenant, client, secret, scope. The result should look like this:
I’m not parsing the JSON in my example but use String functions. Therefore I’m looking for the location of access_token in the response and cut out the bearer token string. I know this is not the best way to do this but it’s only an example. VBA and Excel have a limited view on strings. Don’t get confused if the value you see in the debug window or MSGBOX is not the complete bearer token string.
Dim objHTTP As Object
Set objHTTP = CreateObject("MSXML2.ServerXMLHTTP")

Dim strURL As String
strURL = "https://login.microsoft.com/_YOUR_TENTANT_ID_/oauth2/v2.0/token"

Dim strData As String
strData = "tenant_id=__&client_id=___&client_secret=___&grant_type=client_credentials&scope=___.operations.eu.dynamics.com/.default"

objHTTP.Open "POST", strURL, False
objHTTP.send (strData)

Dim strResponse As String
strResponse = objHTTP.responseText

Set objHTTP = Nothing

'Find the access token in the response
Dim posAccessToken As Integer
posAccessToken = InStr(1, strResponse, "access_token", vbTextCompare)
posAccessToken = posAccessToken + 14

Dim token As String
token = Right(strResponse, Len(strResponse) - posAccessToken)
token = Left(token, Len(token) - 2)
Query OData Entity
You can query entities using HTTP GET and provide OData query syntax values like $filter and $select. In my example I’m looking for a certain customer by its CustomerAccount and select only the OrganizationName. The %20 and %27 in the address are URL encoded Blanks _ and Quotes “.
Like in the code above I’m using string functions instead of JSON parsing for this example. The customer account is in cell B2, the name will be written to B3. I had to manually add a reference to MSXML2.ServerXMLHTTP.6.0 version in the VBA Code Editor (Menu Bar, References). Here is the VBA code to call the Odata query.
Dim custAccount As String
custAccount = Cells(2,2).Value

Dim objHTTP2 As Object
Set objHTTP2 = CreateObject("MSXML2.ServerXMLHTTP.6.0")

Dim strUrl2 as String
strURL2 = "https://_YOUR_INSTANCE_.operations.eu.dynamics.com/data/CustomersV3?$filter=CustomerAccount%20eq%20%27" & custAccount & "%27&$select=OrganizationName"

objHTTP2.Open "GET", strURL2, False
objHTTP2.setRequestHeader "Authorization", "Bearer " & token
objHTTP2.send

Dim strResponse2 as String
strResponse2 = objHTTP2.responseText
Set objHTTP2 = Nothing

Dim posCustomerName As Integer
posCustomerName = InStrRev(strResponse2, "OrganizationName")
posCustomerName = posCustomerName + 18

Dim d365CustomerName As String
d365CustomerName = Right(strResponse2, Len(strResponse2) - posCustomerName)
d365CustomerName = Left(d365CustomerName, Len(d365CustomerName) - 3)
d365CustomerName = Left(d365CustomerName, InStr(1, d365CustomerName, "}") - 1)

Cells(2,3).Value = d365CustomerName
Load Dynamics 365 F/SCM in Synapse and visualize in PowerBI
Synapse link for Dataverse is the replacement for Export to Datalake which has been deprecated in 2023. Although it is called link for Dataverse, it can be used to access Dynamics 365 Finance and Supply Chain tables (and CE data from dataverse as well).
SQL Track Changes has to be enabled in D365 F/SCM. Creates, Updates and Deletes are written to a storage account in CSV format. Synapse is running a spark pool that converts the CSVs into Deltalake format which relies on the (Open-Standard) Parquet format. As result you can see and query the F/SCM tables in the lake like it were tables in a relational database.
Good news, Synpase has a serverless SQL pool and a public SQL endpoint. You can find the SQL endpoint from the Manage Icon (down left) > SQL Pools > Select your pool > Workspace SQL Endpoint.
You can create databases in this SQL pool and create views based on the tables in the datalake. For example join CustTable and DirPartyTable and provide a view that contains customer data with a name and address.
You can use the development workspace in Synapse web based workspace but you could also use other tools to connect e.g. SQL Server Management Studio. Tables in the datalake and views in another database can be accessed.
PowerBI has a built-in connector for Synapse Workspace. You can easily load data from the tables and also from the views.
Data Management in Dynamics 365 Finance and Supply Chain Management can be used to export Entities in different formats like XML. In many cases the default Entity schema is not what you want. However, you can easily transform the XML output by applying an XSLT transformation directly in Dynamics.
I’ve made a short video how to transform the EcoResReleasedProductsV2 XML entity export into another schema with different structure and element names.