I recently had to find a broken reference in an Excel file, where data was copied from one version of the file to another. In the original version there was a data validation rule with a dropdown to a list of allowed base data from another excel sheet.
Drop down to choose from list of value
In a next step the original file was copied and modified to fit new requirements. Meanwhile the original file was used and data was collected in the old file.
After the new file version was approved, the data from the old version was copied (CTRL+C , CTRL+V) to the new file and the old file was removed. However, when opening the new file excel reported a broken link to the old file.
Broken reference after copying data
While this problem can easily be identified in a small excel, this can be a challenge in a huge file with lot of sheets. One way to identify the problem is to unzip the excel file (e.g. using winrar, 7zip, etc). A excel file contains many XML and other files. The worksheets for examle can be found in the xl/worksheets folder
Excel file opend in Winrar
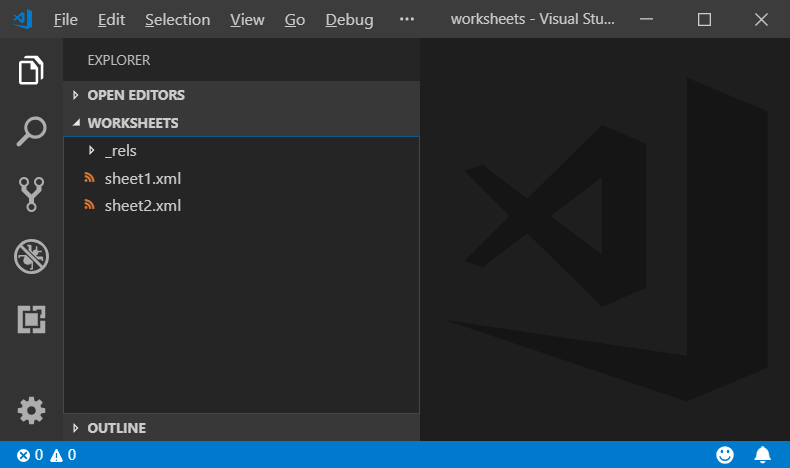
After extracting the worksheet folder to the file system, you may use a tool like Visual Studio Code and open the folder.
Open extracted excel folder in VS Code
Simple by searching for the name of the broken reference you will find the place where to fix the problem
Calling a web service with HTTP Basic Authentication is easy in C#. Here I’m using a REST service via HTTP GET which is secured via Basic Authentication.
C# Code
A HTTP GET webservice call using System.Net.WebRequest and System.Net.Webrespose in C#
The product configuration model in Dynamics 365 for Finance and Operations is a great tool dynamically generate production orders including bill of materials (ProdBOM) and routes. In the product configuration model, the user is free to define attributes of different types, and use these attributes for calculations and conditions within the model. However, I had to come up with a solution to write the attribute value from the production configuration wizard to the generated ProdBOM. Here is an example code how this can be done:
Data type, table and form extensions
Create a new string EDT and call it ERPPCStringAttribute
Create table extensions for the BOM and ProdBOM and add a new field based on the ERPPCStringAttribute EDT
Create a form extension for the ProdBOM and add the new field in the grid (Tab > Overview > Grid)
Extend the PCBOMLineDetails form
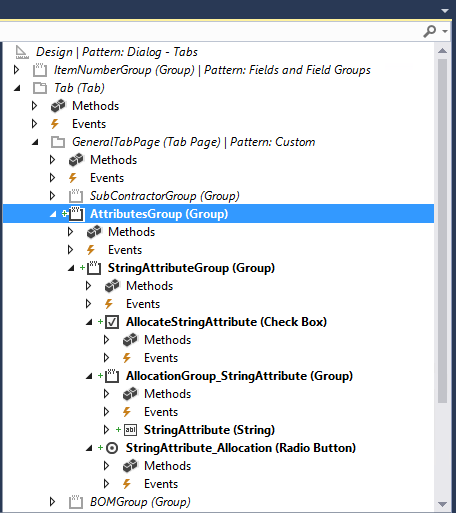
This is a tricky part. In the form for the BOM line details in the product configuration model, create a section for the attribute that looks the same like all the others. Here is a screenshot from Visual Studio:
You need to create a group, hat contains another group, with a checkbox and group with a string edit field and a radio button. Make sure to name the elements like shown in the screenshot. If you are not sure, compare it with the other existing groups e.g. the SubContractor. You will need to compare the properties of each element with the corresponding properties of an existing element to make it look similar.
Extend PCBOMLineDetails Form UI logic
You cannot overwrite methods on UI elements in form extensions e.g. clicked() . Therefore you have to implement the logic for the UI elements in a separate class. Create a new class ERPPCBomLineDetailsEventHandler and implement the following UI logic for clicked(), modified() and lookup()
Like many forms in Dynamics 365 for Finance and Operations the form has a class-behind that implements the business logic. You need to extend this class in order to deal with the newly created Attribute group. Create a new class ERPPCBomLineDetails_Extension and impelement the following logic:
[ExtensionOf(formStr(PCBOMLineDetails))] final class ERPPCBomLineDetails_Extension { public PCClass component() { return component; }
[ExtensionOf(FormMethodStr(PCBOMLineDetails,loadAllocations))] public void loadAllocations() { PCTemplateAttributeBinding templateAttributeBinding; PCTemplateAttribute fieldReference;
Implement the following classes to extend the product configuration model framework in Dynamics 365 Finance and Operations:
PcAdaptorBOMLine class:
[ExtensionOf(classStr(PcAdaptorBOMLine))] final class ERPPcAdaptorBOMLine_Extension { public ERPPCStringAttribute parmWANPCStringAttribute( ERPPCStringAttribute _stringAttribute = bom.ERPPCStringAttribute) { EcoResTextValue value;
By default the framework does not recognize to create template records for the newly added attribute field. Therefore you have to delete the existing templates and trigger the framework to reinitialize. Be aware, this might harm your existing models!
PCTemplateInitialize class:
[ExtensionOf(classStr(PcTemplateInitialize))] final class ERPPCTemplateInitialize_Extension { public static void main(Args _args) { PCTemplate tableTemplate; PcTemplateInitialize init = PcTemplateInitialize::construct(); delete_from tableTemplate; init.run(); } protected void createTemplatesForBOM() { next createTemplatesForBom(); PCTemplate tableTemplate; select firstonly tableTemplate where tableTemplate.ReferencedTableId == tableNum(BOM); this.createFieldTemplate(tableTemplate,fieldNum(BOM, ERPPCStringAttribute )); } }
Start this class from Class Runner or add a menu item to call it by hand.
Test your Implementation
Create a new product configuration model
Add a new attribute “notes” of type string
Add a BOM line to the model
Open the BOM line details and assign the notes attribute to the string attribute 1
Save the model
Create and approve the model version
Create a new production order
Use the configuration wizard to provide a text value for the notes attribute
Create the production order
Verify that you can see the attribute value in the ProdBOM of your production order
A very common task required by Dynamics 365 Finance and Operations clients is to send a report directly from the report viewer. This can be achieved with a view lines of Code. Here is video on Youtube how it works:
This video explains how you can use the product configuration model in D365 FO to model a heater. The heater can have a length between 0.5 m – 4,5 m, can have a certain color and provide an analog handle, a touch panel or a remote control. Touch panel and remote control is only available for heaters > 1m . A heater contains of heating units (4x 1m), requires connector modules between each 4 heating units and an enclosed. The product configuration model is used to define these requirements and constrains, provide a wizard for production configuration and generates the correct BOM.
Enterprise Resource Planning (ERP) system vendors need to customize their products according to the domain-specific requirements of their customers. Systematic reuse of features and related ERP product customizations would improve software quality and save implementation time. In our previous research, we have developed a tool-based approach supporting feature-based reuse of ERP product customizations. Our tool environment automatically infers reusable features from requirements and their associated implementation artifacts. Furthermore, it allows domain experts to search for features based on natural language requirement descriptions representing the needs of new customers. Matching features can be automatically deployed to a new ERP product. In this paper, we present an industrial evaluation of our tool-based approach conducted together with an Austrian small- to medium-sized enterprise. A domain expert used our approach to identify matching features for 20 randomly selected requirements for new customer products and identified matching features for 17 of the 20 requirements. We compared the time needed to identify and deploy the candidate features with the time required to implement the requirements from scratch. We found that, in total, over 60% implementation time can be saved by applying our reuse approach presented in this case study.
I recently faced a customer requirement in Dynamics AX 2009 where a customer needs two lookups in report dialog. Depending what was selected on the first lookup (InventLocation), the content of the second lookup should be filtered (WMSLocationId). Michael has already documented in his blog how to overwrite a lookup in dialog. In order to override the lookup methods a RunBaseReport class is needed to call the the report.
class WarehouseReportRun extends RunBaseReport
{
Dialog dlg;
Implement the abstract method lastValueElementName and provide the name of the report to start. In my case the report is called WarehouseReport.
public identifiername lastValueElementName()
{
return reportStr(WarehouseReport);
}
Create a menu item and start the class. Right click the lookup fields and from the setup form note the name of the lookup fields. In my case the system generated name for the first lookup field is Fld6_1 (InventLocation) and the name for the second is Fld7_1 (WMSLocation)
According to michaels blog overwrite the dialogPostRun method. Here you can defined that you want to overwrite methods and link an object with the overwritten methods.
public void dialogPostRun(DialogRunbase dialog)
{
super(dialog);
Next implement the code for the lookup on the second lookup field in the dialog. In my case it will only show WMSLocations for the selected InventLocation in the first lookup.
Test the class. It will only show WMSLocations for the selected InventLocation.
In the last step overwrite the init method in the report and set the range according to the values from the lookup fields. In my report I have a InventSum datasource linked with an InventDim datasource. I use the parm methods to set the InventDim ranges on the InventLocation and WMSLocation
A often recurring requirement is a graphical inventory overview showing the usage of locations. There are many ways how to implement such a solution. One simple way is to use data shapes in Visio and link them to Dynamics Ax data.
Visio
Since every warehouse is different, you have to create a separate Visio drawing for each one. Visio provides you with good standard shapes to draw a floor plan. In this example I am using a simple drawing of a warehouse with one door and 12 locations. In my example a square in Visio represents a WMSLocation in Dynamics AX. Create one Visio file per warehouse and save it on a file share.
Data
Next create a view for each warehouse on the Dynamics AX database. Ask you DBA to secure access to the view for your users. Here is an example SQL code I am using to fetch data from Location 11 and 12 ( Contoso Demo Data)
SELECT w.INVENTLOCATIONID, w.WMSLOCATIONID, w.DATAAREAID, w.VOLUME, COALESCE (l.CURRENTVOLUMEADJUSTED, 0) AS CURRENTVOLUMEADJUSTED, w.VOLUME – COALESCE (l.CURRENTVOLUMEADJUSTED,0) AS FreeTotal, (w.VOLUME – COALESCE (l.CURRENTVOLUMEADJUSTED, 0)) * 100 / w.VOLUME AS FreePercent FROM dbo.WMSLOCATION AS w LEFT OUTER JOIN dbo.WMSLOCATIONLOAD AS l ON w.INVENTLOCATIONID = l.INVENTLOCATIONID AND w.WMSLOCATIONID = l.WMSLOCATIONID AND w.DATAAREAID = l.WMSLOCATIONDATAAREAID WHERE (w.VOLUME > 0) AND (w.DATAAREAID = ‘USMF’) AND (w.INVENTLOCATIONID = ’11’) OR (w.INVENTLOCATIONID = ’12’)
Link SQL Data to Visio shapes
In the Visio main menu go to the Data tab and Link Data with Shapes. Go through the wizard and connect to your SQL Server and the view you have just created. This will open the External Data window showing the results from the SQL query.
In the Visio drawing panel select the first square that represents a location. Right click on a record in the external data grid and select Link to selected shape. A chain symbol will appear next to the record, showing you that this record is new linked to a shape in your drawing.
Right click on the shape that is now linked to a record in the external data. In the shapes context menu go to shape data and open edit data graphic. Here you can add and format the column values from the record to the shape. In my case I’ve formatted the InventLocationId as Header and the FreePercent as progress bar.
Once you have formatted one shape you can copy & paste it multiple times. You only need to selected the copy and then right click on the corresponding row in the external data and link to shape. This will update the shape data with the values from the new record.
View in Dynamics AX
Finally some work is needed in Dynamics AX to view the Visio drawing. At the InventLocation table add a new field using the FileName extended data type. Add the field in the InventLocation form, so you can provide a Visio file path for each InventLocation.
Create a new form and add an ActiveX control. Use the Microsoft Visio Document class.
Overwrite the init() method of the form to load the Visio document.
public void init() { InventLocation inventLocation; super();
Create a display menu item for the form and add it to the InventLocation form. Make sure to set the InventLocation as data source for the menu item. Now if you have created a Visio document and provided the file path in the InventLocation record, by clicking on the menu item you can see a graphical representation of your warehouse.
A customer recently asked to create a PowerBI report in order to group and compare ledger postings. The report had to meet the following requirements:
Compare two time periods
Group postings by account and type (e.g. Assets)
Postings on a certain cost center need to be shown separately
Grouping of accounts and cost centers are defined by a key user in Excel
e.g. 1001 – 1104 and 5001 – 5002 are “Assets”
Cost center groups are defined by using wildcard style
e.g. 601500 – 61500 and Costcenter ?6?? is Development/Compliance
Report Data from Dynamics AX
First, we loaded the report data from Dynamics AX into PowerBI. The data contained the LedgerJournalTrans joined with the LedgerAccountView. The Dimenions were renamed to Department, CostCenter and CostUnit.
select
T.TRANSDATE, T.AMOUNTCURCREDIT, T.AMOUNTCURDEBIT, T.ACCOUNTNUM, V.ACCOUNTNAME, DIMENSION as DEPARTMENT, DIMENSION2_ as COSTCENTER, DIMENSION3_ as COSTUNIT
from LedgerJournalTrans as T
join LEDGERACCOUNTVIEW as V
on T.ACCOUNTNUM = V.ACCOUNTNUM
where ACCOUNTTYPE <= 2
Report Definition Data
Next we defined and loaded the report definition from Excel. We used to sheets, one for the definition of the two time frames and one for the group definition
Like initially described the Accounts sheet defines the grouping of postings regarding their account number. For example in line 2 and 3 postings on accounts 1101 .. 1104 and 5001 .. 5002 shall be grouped as “Assets”. Postings on accounts 601500 .. 606300 with a cost center where the 2nd character is 6 shall be grouped separately as “Development/Compliance” regardless if they are also part of the group “Expenses”.
Both Excel worksheets were loaded into PowerBI. The Accounts was modifed to replace an empty value in the Costcenter column with the text “%”. This was done to use the Costcenter value in a SQL statement with a Like clause (see section “Calling function from the account definition”).
Query Parameter
We added 3 parameters to the PowerBI called FromAccountNum, ToAccountNum and CostCenter. The default values are the smallest account number for the FromAccountNum, the largest account number for the ToAccountNum and the text % for the CostCenter.
Next we changed the query of LedgerJournalTrans and added the parameter to the query. This can be done used “Edit query” on the data set and opening “Advanced Editor”
The new query text in the advanced editor looked like this
let
Source = Sql.Database(“localhost”, “DynamicsAx”, [Query=”select T.TRANSDATE, T.AMOUNTCURCREDIT,T.AMOUNTCURDEBIT, T.ACCOUNTNUM,V.ACCOUNTNAME,DIMENSION as DEPARTMENT,DIMENSION2_ as COSTCENTER,DIMENSION3_ as COSTUNIT #(lf)from LedgerJournalTrans as T#(lf)join LEDGERACCOUNTVIEW as V on T.ACCOUNTNUM = V.ACCOUNTNUM #(lf)where ACCOUNTTYPE <= 2 AND T.ACCOUNTNUM >= “&FromAccountNum&” AND T.ACCOUNTNUM <= “&ToAccountNum&” AND T.DIMENSION2_ like ‘”&CostCenter&”‘ #(lf)order by T.ACCOUNTNUM,T.TRANSDATE#(lf)”, CreateNavigationProperties=false])
in
Source
With the parameter in the query and the default values set to the parameters the dataset did not change. Next we added a new function to the LedgerJournalTrans. This can be done from the context menu of the query “Create Function”. PowerBI inspects the query statement and creates function parameter for each parameter in the query. In this case FromAccountNum, ToAccountNum and CostCenter.
Calling function from the Account Definitions
In PowerBI a function call can be used like a row wise join. A function can be added by using the used defined function button in the query editor. So we added the function call to the Accounts dataset, i.e. each account definition row fetches all postings from the LedgerJournalTrans with the corresponding accounts and costcenter.
The query parameter are mapped to the fields in the Accounts table.
PowerBI will popup a warning that function calls can have a security impact. In the actual version (Mai 2018) PowerBI was quite annoying with security warnings and required a restart (close&open) to stop asking again and again. Finally, expand the Accounts table and the function call results by clicking on the Arrow Right-Left Button next to “GetPostings”. Per default PowerBI adds the fields from the function call result with the function name prefix e.g. GetPostings.Transdate, GetPostings.AmountCurCredit, etc.
As you can see below the Account definition 1101 – 1104 was expanded with all resulting rows from the LedgerJournalTrans that have an account between 1101 and 1104 and any Costcenter (%)
Calculate Period Amounts
To get the amount values for each of the two periods, defined in the Daterange Excel sheet, we added 4 additional columns to the Accounts. A debit and credit column for period 1 and period 2.
Finally we used a matrix to display the values from the Accounts dataset and grouped it by Name and Accounts.
Security considerations
Injecting range values in a query is not the best way to do this. A better way would be to refactor the LedgerJournalTrans query into a stored procedure and provide the FromAccountNum, ToAccountNum and Costcenter as parameter to the SP.