PowerBI: Compare different Timespans and Products in one Matrix
21. August 2022 Leave a comment
A recent requirement at a customer was to compare Sales Quantity and Sales Totals of different time spans in one matrix. The customer is selling saisonal as well as all-time products. It should be possible to compare the sale of saisonal products from last season to the actual sales.

Data Model
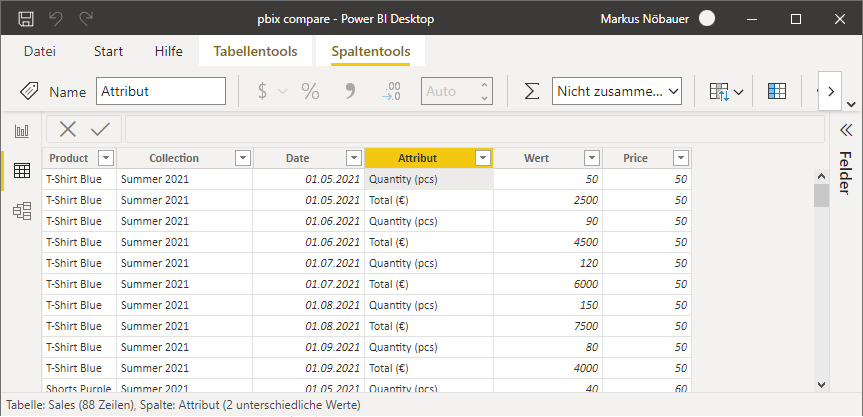
The original data contains 6 rows: The product, the corresponding collection, the sold quantity, the unit price, calculated total price (Qty * Price), date.

In order to make the Quantity and Totals available for a row-like visualization the original data was unpivoted. This created a new column called “Attribute” and another Column called “Value”. The unit (pcs, €) have been added to the attribute to make it more readable. The resulting data looks like the following in PowerBI:
Filter tables
To implement 2 independet filter options based on date and collection 4 independet tables have been added. A date table and a collection table for both filter options. The date tables can easily be generated by using the Calendar() function:
Filter1Date = CALENDAR(Date(2021,1,1), Date(2022,12,31))Filter2Date = CALENDAR(Date(2021,1,1), Date(2022,12,31))The collection tables are generated by using the Distinct() function on the collection column in the sales data table. Each of the tables contain a distinct list of collections available for filtering.
Filter1Collection = DISTINCT(Sales[Collection]) Filter2Collection = DISTINCT(Sales[Collection])
Measures
Three measures have been create. Two measures that sum up the Value column in the sales data filtered on the selected values in the Filter1* table or Filter2 table:
M_Sum1 = CALCULATE(
    SUM(Sales[Wert]),
    FILTER(
        Sales,
        Sales[Date] >= FIRSTDATE(Filter1Date[Date]) &&
        Sales[Date] <= LASTDATE(Filter1Date[Date]) &&
        Sales[Collection] in VALUES(Filter1Collection[Collection])
        )
    )
M_Sum2 = CALCULATE(
SUM(Sales[Wert]),
FILTER(
Sales,
Sales[Date] >= FIRSTDATE(Filter2Date[Date]) &&
Sales[Date] <= LASTDATE(Filter2Date[Date]) &&
Sales[Collection] in VALUES(Filter2Collection[Collection])
)
)The third measure calculates the difference between the other two measures:
M_Diff = [M_Sum2]-[M_Sum1]Visuals
Finally the report contains 5 visuals. Two slicers for date and collection on the left, another two slicers for date and collection on the right, and a matrix in the middle. The matrix shows the Attribute column as row and shows M_Sum1, M_Sum2 and M_Diff as values.
For example comparing collection “Summer 2021” from 1. Jan. 2021 till 30. Sep. 2021 to the aggregated values of “Collection 2022” + “Basic Wear” from 1. Jan 2022 till 30. Sep. 2022.
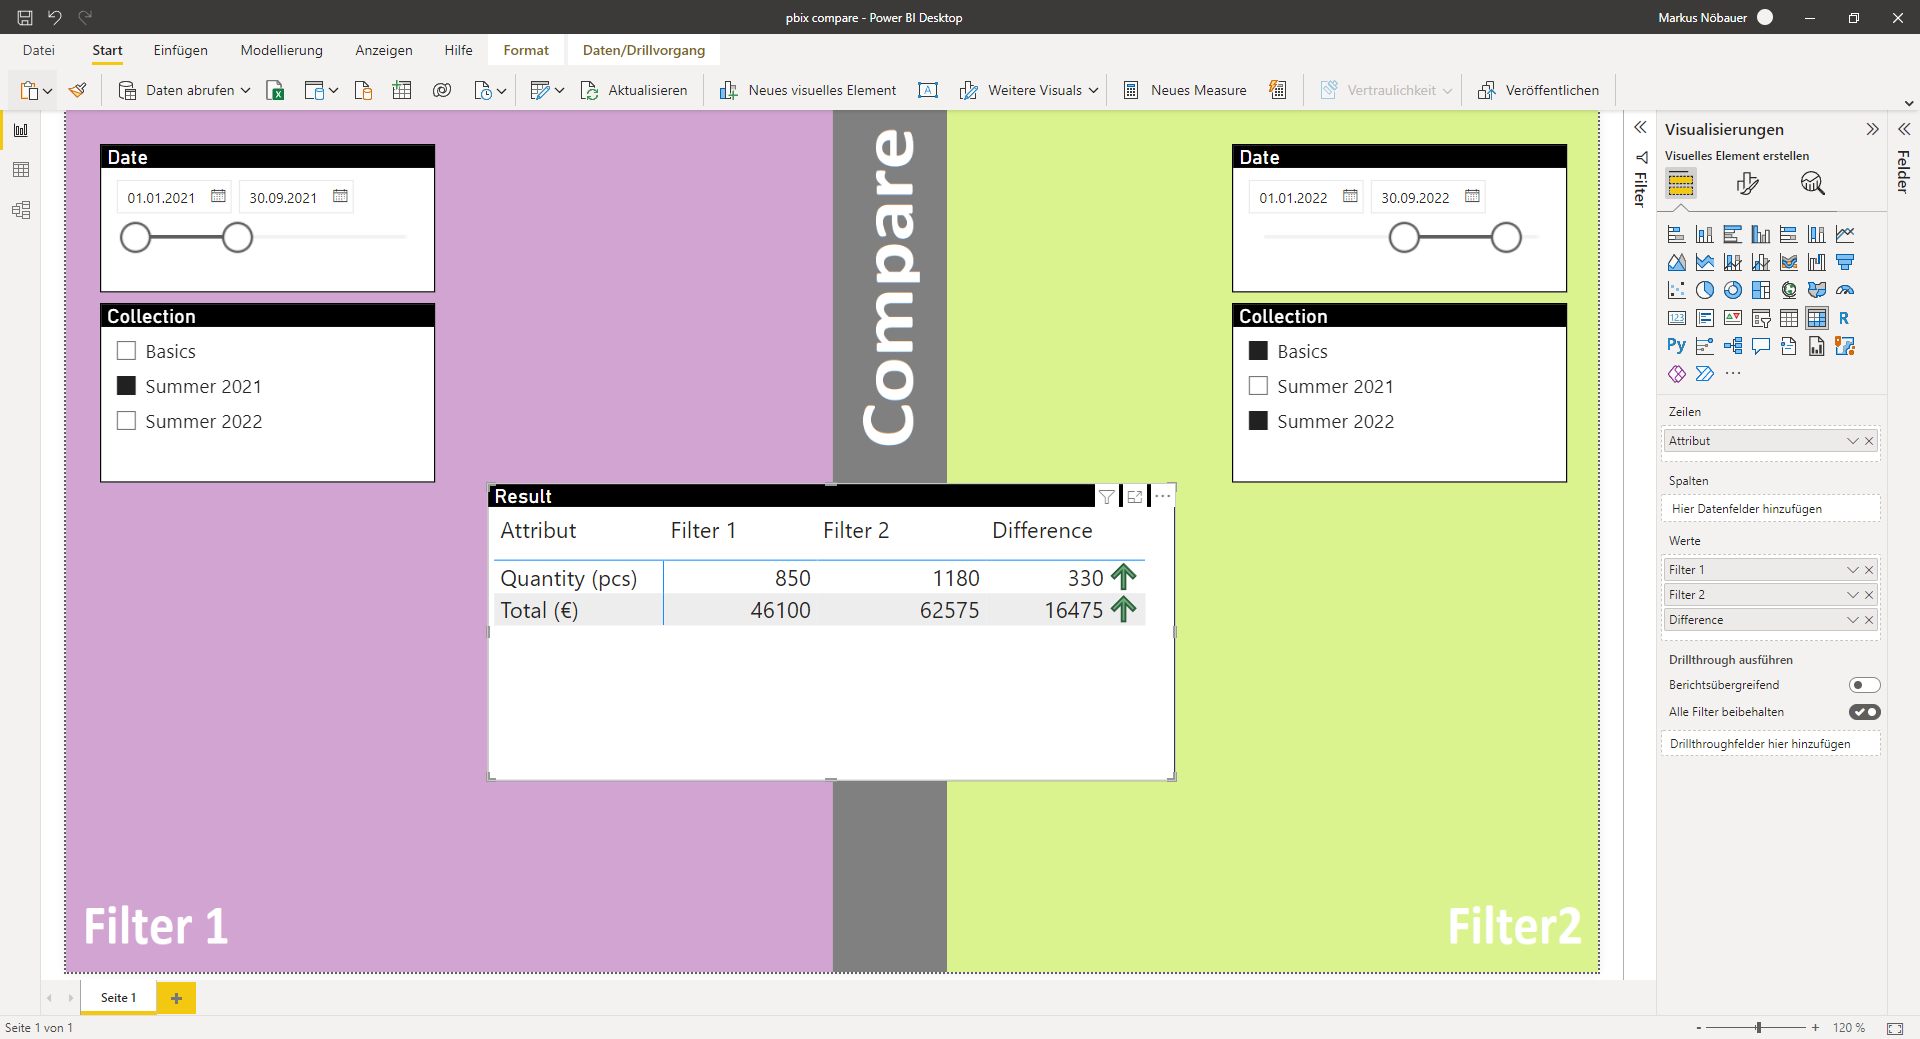
The slices on the left only affect the M_Sum1 measure which shows quantity and totals in the Filter1 column while the slicers on the right effect only M_Sum2 measure which shows the results in Filter2 column. The difference is calculate dynamically when adjusting the slicers.


